
App Insights Queries
This page provides ready-to-use Kusto queries for monitoring and troubleshooting Fluxx-related Kubernetes pods in Azure Application Insights.
Tip: These queries are designed for both developers and QA. Adjust pod names, time windows, and operation IDs as needed for your investigation.
Usage Notes
- Change pod names (e.g.,
fluxx-extractor-...) to match your target pod(s). - Adjust time windows (e.g.,
ago(2h),datetime(...)) for your needs. - Replace
<operation-id>with the actual operation ID you want to trace. - Kusto Query Language docs
Kubernetes Logs Workflow
- Go to your Kubernetes cluster in Azure, then open Monitoring -> Logs.
- Do not go to Application Insights directly for this workflow.
- In the Logs page, switch from Simple mode to KQL mode:
- Select KQL mode (or Switch to KQL) in the query editor toolbar.
- If prompted, confirm switching to the full query editor.

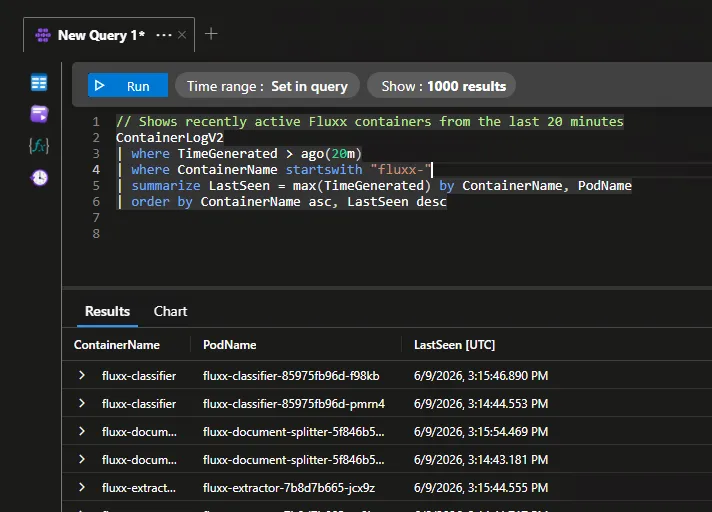
Get active Fluxx pod names (last 20 minutes)
Use this query first to find the pod name you want to inspect.
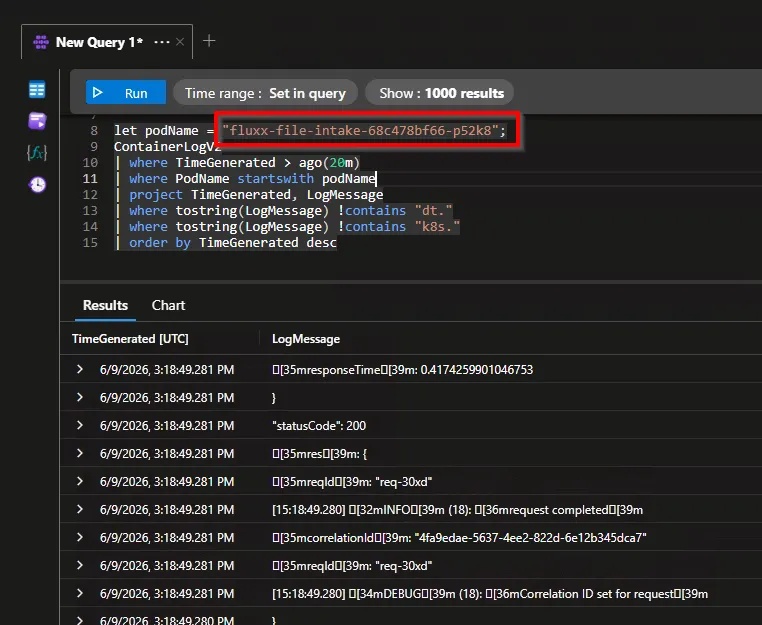
Get logs for a specific pod
Replace
<pod-name>with the full pod name from the previous query. This returns actual logs from the selected pod while excluding common platform noise.
General Pod Monitoring
Pods seen in the last 2 hours
Lists all pods that have sent logs in the last 2 hours.
Fluxx pods seen in the last 2 hours
Lists only pods with names starting with
fluxx-.
Error & Exception Analysis
Recent errors and critical logs across Fluxx pods
Shows recent errors and critical logs. Adjust
severityLevelif you want to include warnings (2) or info (1).
Error counts by pod
See which pods are generating the most errors.
Exceptions with related pod names
Shows exceptions grouped by pod.
Failed requests by operation
Finds which operations are failing most often.
Performance & Trends
Warning/error trend over time
Visualize warning and error trends. Adjust the
bininterval for finer or coarser granularity.
Slowest requests
Finds slowest operations by average and 95th percentile duration.
Log Analysis
Most common log messages
Shows the most frequent log messages. Useful for spotting noisy or recurring issues.
Non-verbose logs for one extractor pod
Replace
<pod-id>with the actual pod name.
Non-verbose logs for all extractor pods
Shows all non-verbose logs for extractor pods.
Correlate logs for a single operation
Replace
<operation-id>with the actual operation ID to trace a request across services.
Logs for a pod around a specific time window
Replace
<pod-id>and the datetime values with your target pod and time window.
Health Monitoring
Pods that stopped logging recently
Lists pods that have not logged in the last 15 minutes. Adjust
activeWindowas needed.